
Spatial Variation of Housing Prices and Its Drivers
A short research paper: abstract, numbered equations, a three-line table and a bibliography from a .bib file.
Download the source, unzip it and drop the folder onto the converter — then change the text to make it yours.
Open the converter---
title: Spatial Variation of Housing Prices and Its Drivers
author: Ming Wang, Hua Li
date: September 2026
abstract: Using housing transactions from 36 cities between 2020 and 2025, we estimate a hedonic price model of location, amenities and building age. A one-standard-deviation increase in rail-transit access raises the unit price by about 6.8%.
bibliography: refs.bib
---
# Introduction
Spatial differences in housing prices are a core question of urban research. Most studies rely on hedonic pricing [@smith2021]; others discuss adjustment factors in the sales comparison approach [@zhang2024].
# Model
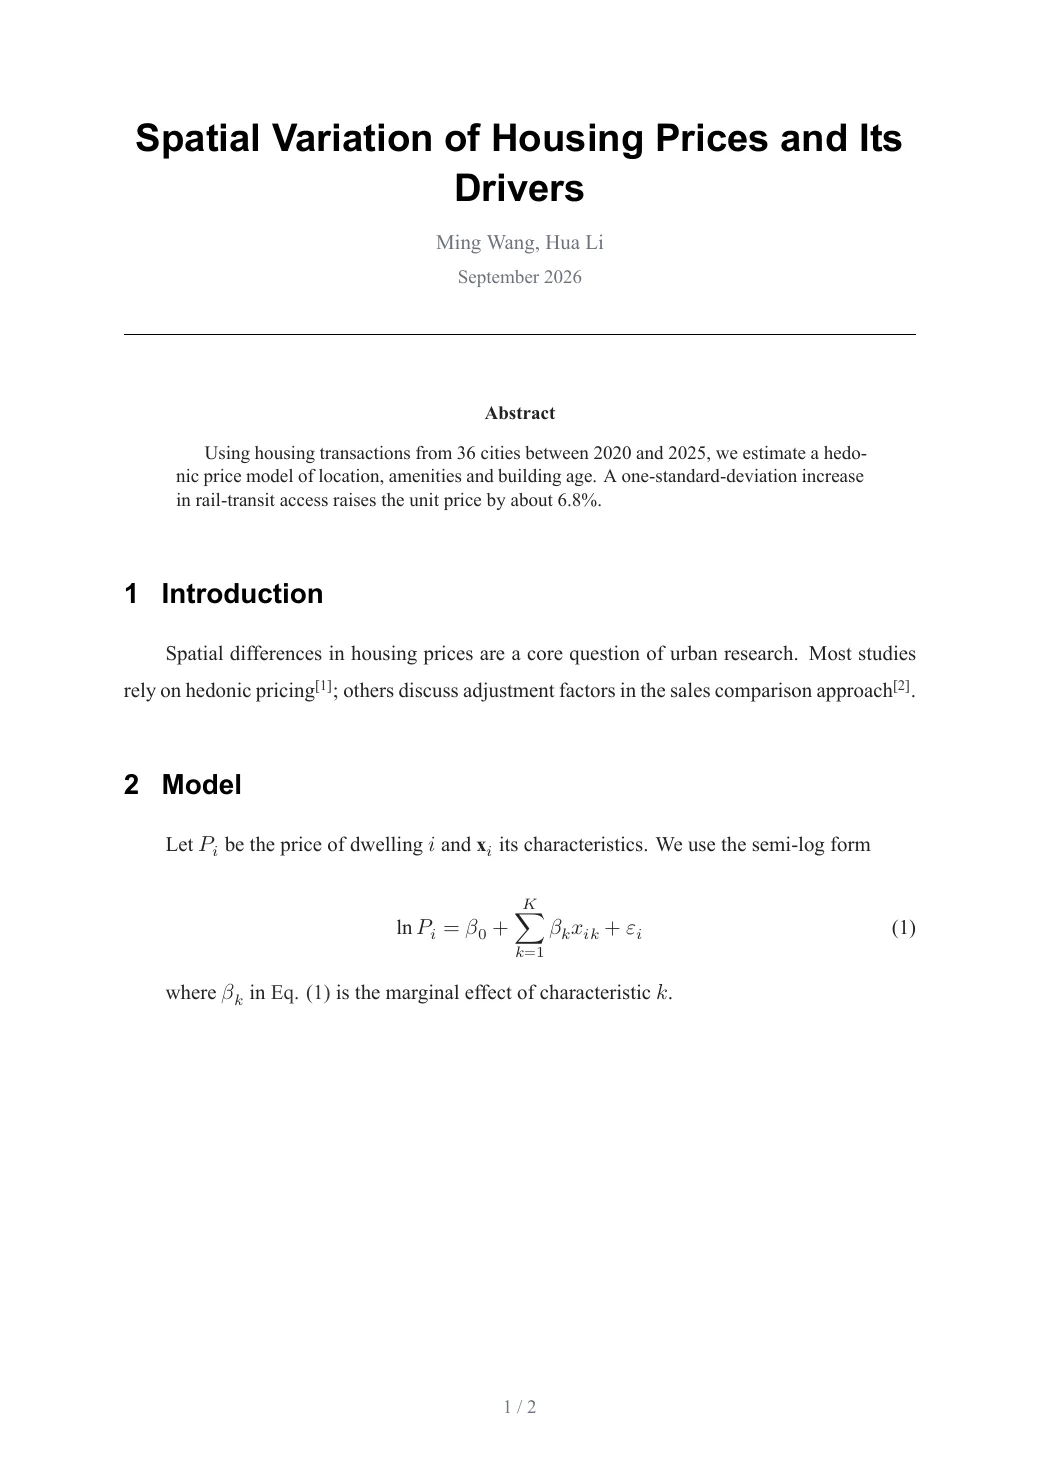
Let $P_i$ be the price of dwelling $i$ and $\mathbf{x}_i$ its characteristics. We use the semi-log form
$$
\ln P_i = \beta_0 + \sum_{k=1}^{K} \beta_k x_{ik} + \varepsilon_i
$$ {#eq:hedonic}
where $\beta_k$ in [@eq:hedonic] is the marginal effect of characteristic $k$.
# Results
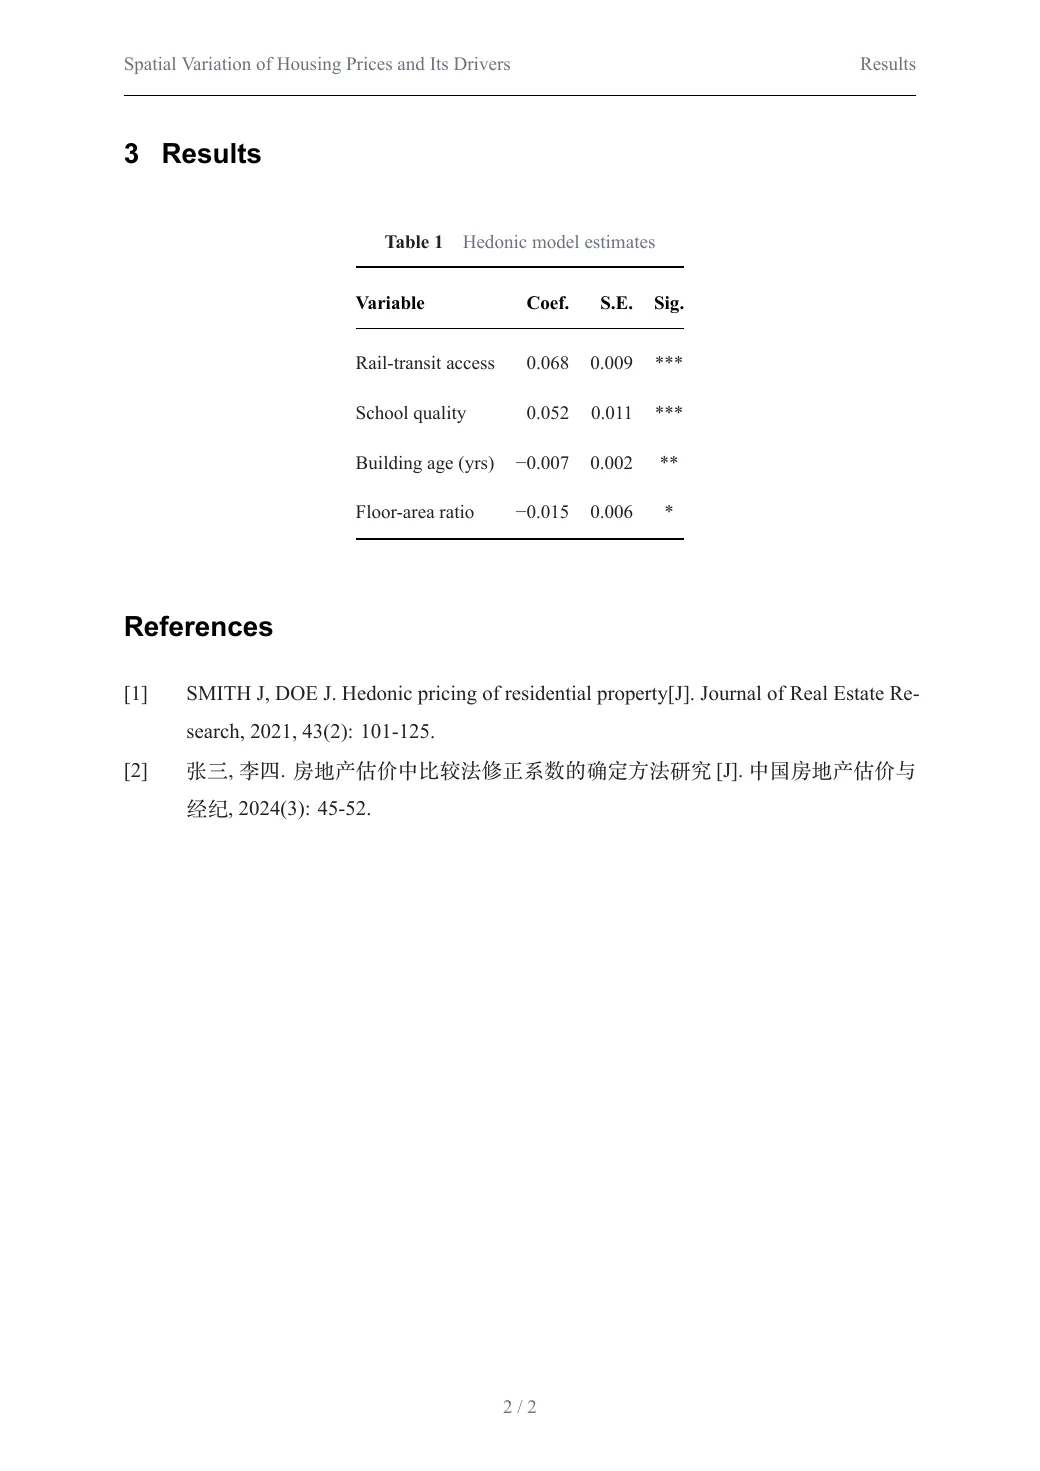
| Variable | Coef. | S.E. | Sig. |
|---------------------|--------:|-------:|:------:|
| Rail-transit access | 0.068 | 0.009 | \*\*\* |
| School quality | 0.052 | 0.011 | \*\*\* |
| Building age (yrs) | −0.007 | 0.002 | \*\* |
| Floor-area ratio | −0.015 | 0.006 | \* |
: Hedonic model estimates {#tbl:est}
# References← All examples · All names, companies and figures in these examples are made up.